
Problem
The client’s current financial reports were manually produced, table-heavy, and difficult to scan. Leadership and finance teams struggled to quickly identify risks or required actions, and the system reporting team spent significant time compiling rather than interpreting data.
Users need a better way to review and report their financial data so that they can better monitor financial health and mitigate risks.
Background & Goals
The client engaged us to design automated dashboards and reporting tables in Oracle Fusion Data Intelligence (FDI).
We identified a few important goals:
Automate manual reporting processes
Standardize report structure across teams
Simplify workflows for finance users
Surface actionable metrics without overwhelming detail
Oracle Fusion Data Intelligence
There are three main user groups of the dashboards:
Executive Leaders: Needed at-a-glance visibility into key indicators and exceptions to drive decision-making
Budget & Financial Planning Team: Needed the ability to move beyond summary views and drill into supporting details to inform planning decisions
Enterprise Data & Analytics Team: Needed designs that are easy to maintain and scale over time, without creating technical debt
outcome & impact
I was able to simplify complex financial workflows, design within enterprise constraints, and deliver high-impact solutions under aggressive timelines.:
Delivered 30+ FDI financial dashboard designs in 3 months with minimal guidance
Established a repeatable dashboard framework that supported rapid delivery without sacrificing clarity.
Balanced simplicity and functionality within system constraints, avoiding unnecessary customization.
design approach
I joined the project mid-sway while it was behind schedule. To regain momentum, I focused on speed, alignment, and reducing rework.
Rapid Domain Immersion: Because I was not part of initial requirement gathering, I closed the knowledge gap quickly.
Reviewed current-state reports and requirement recordings in detail
Researched key financial reporting concepts (GL & Planning) to ensure accuracy in how metrics were structured and presented
Tight Cross-Functional Cadence: To prevent further delays, I established a structured collaboration rhythm:
Daily alignment with the Design Manager to validate direction
Daily touchpoints with development and data teams to confirm feasibility within Oracle FDI and surface constraints early
Structured, High-Efficiency Design Reviews: I redesigned how we ran client reviews to maximize decision-making speed.
Before each session: Prepared targeted questions to guide discussion toward specific decisions
During reviews: Clarified the financial context and key takeaways upfront; walked through wireframes section by section; captured feedback live in Figma to reduce follow-up cycles
Joining a delayed project mid-stream, I rebuilt momentum through closing the knowledge gap quickly and establishing the right rhythm with the team and with the client.
challenges & decisions
Challenge 1: Show Everything vs. Show What Matters
Stakeholders frequently requested that multiple data points be displayed on a single dashboard view. The instinct was to make reports as comprehensive as possible. However, densely packed dashboards increased cognitive load and diluted focus.
SOLUTION
Stakeholders wanted to show everything — I reframed the goal from completeness to decision-making, using visual hierarchy and progressive disclosure to surface what mattered most:
Led with summary KPIs and high-level trends to orient users immediately
Prioritized variances, exceptions, and deltas over raw detail
Used data visualization to direct attention to key takeaways, not just display data
Moved secondary metrics into drill-downs and supporting tables to reduce visual noise
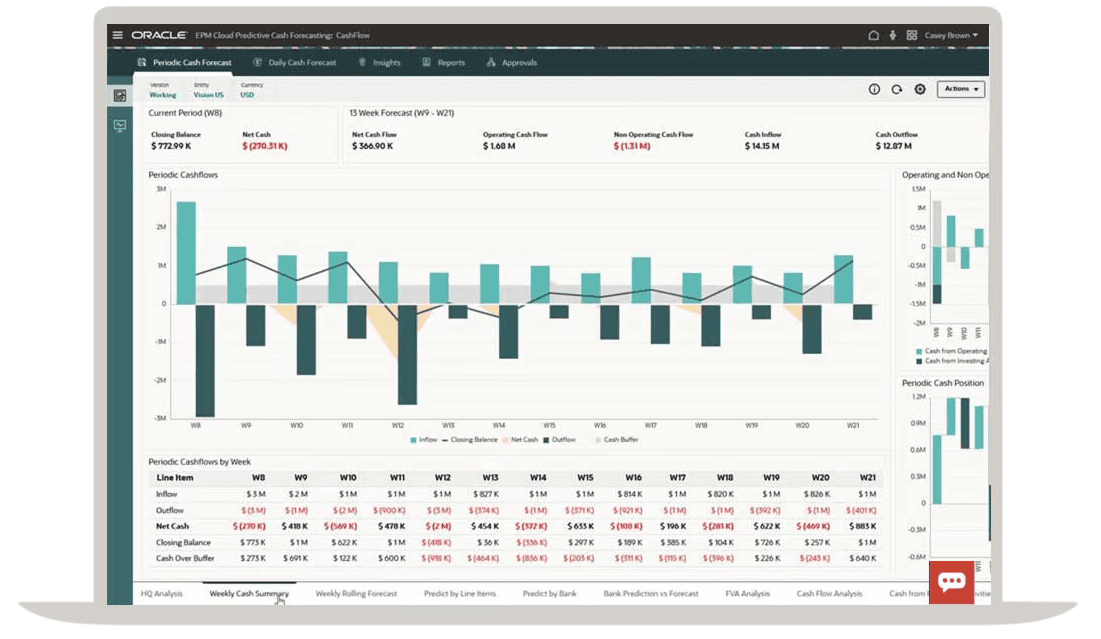
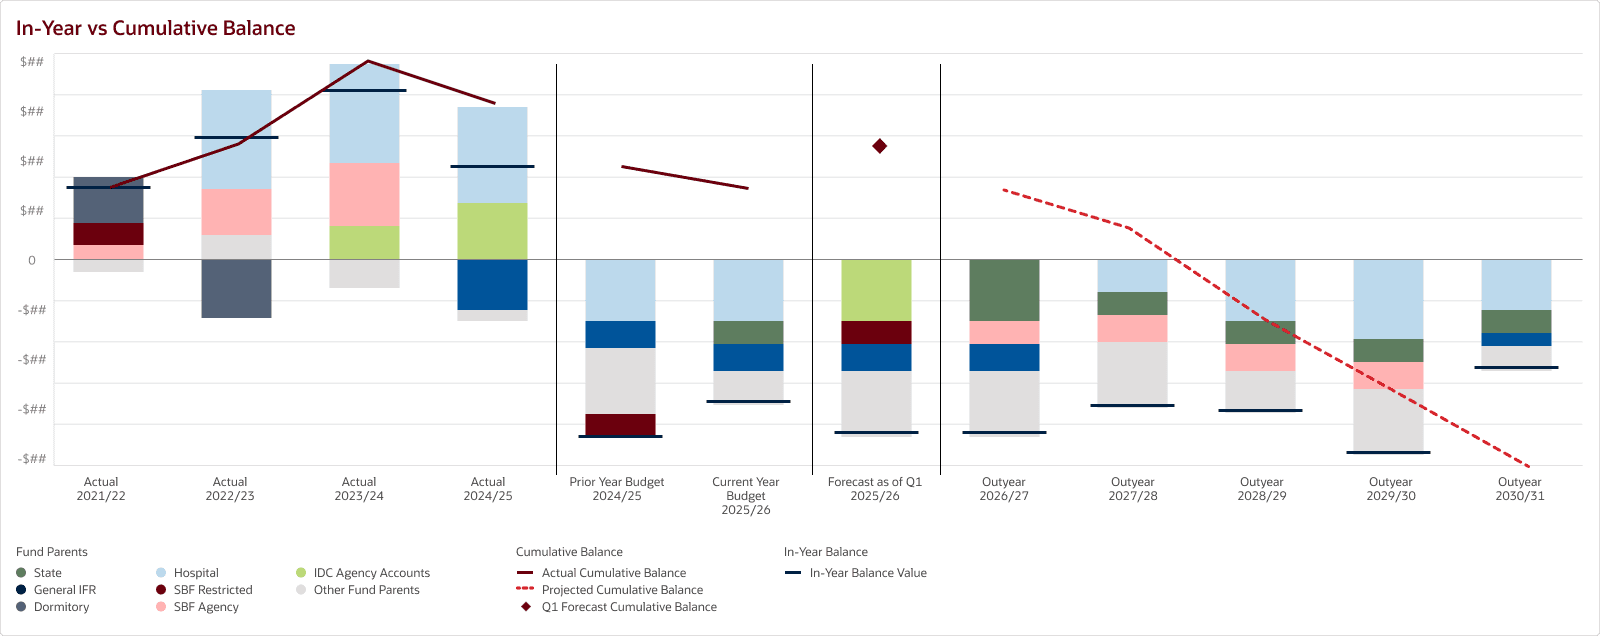
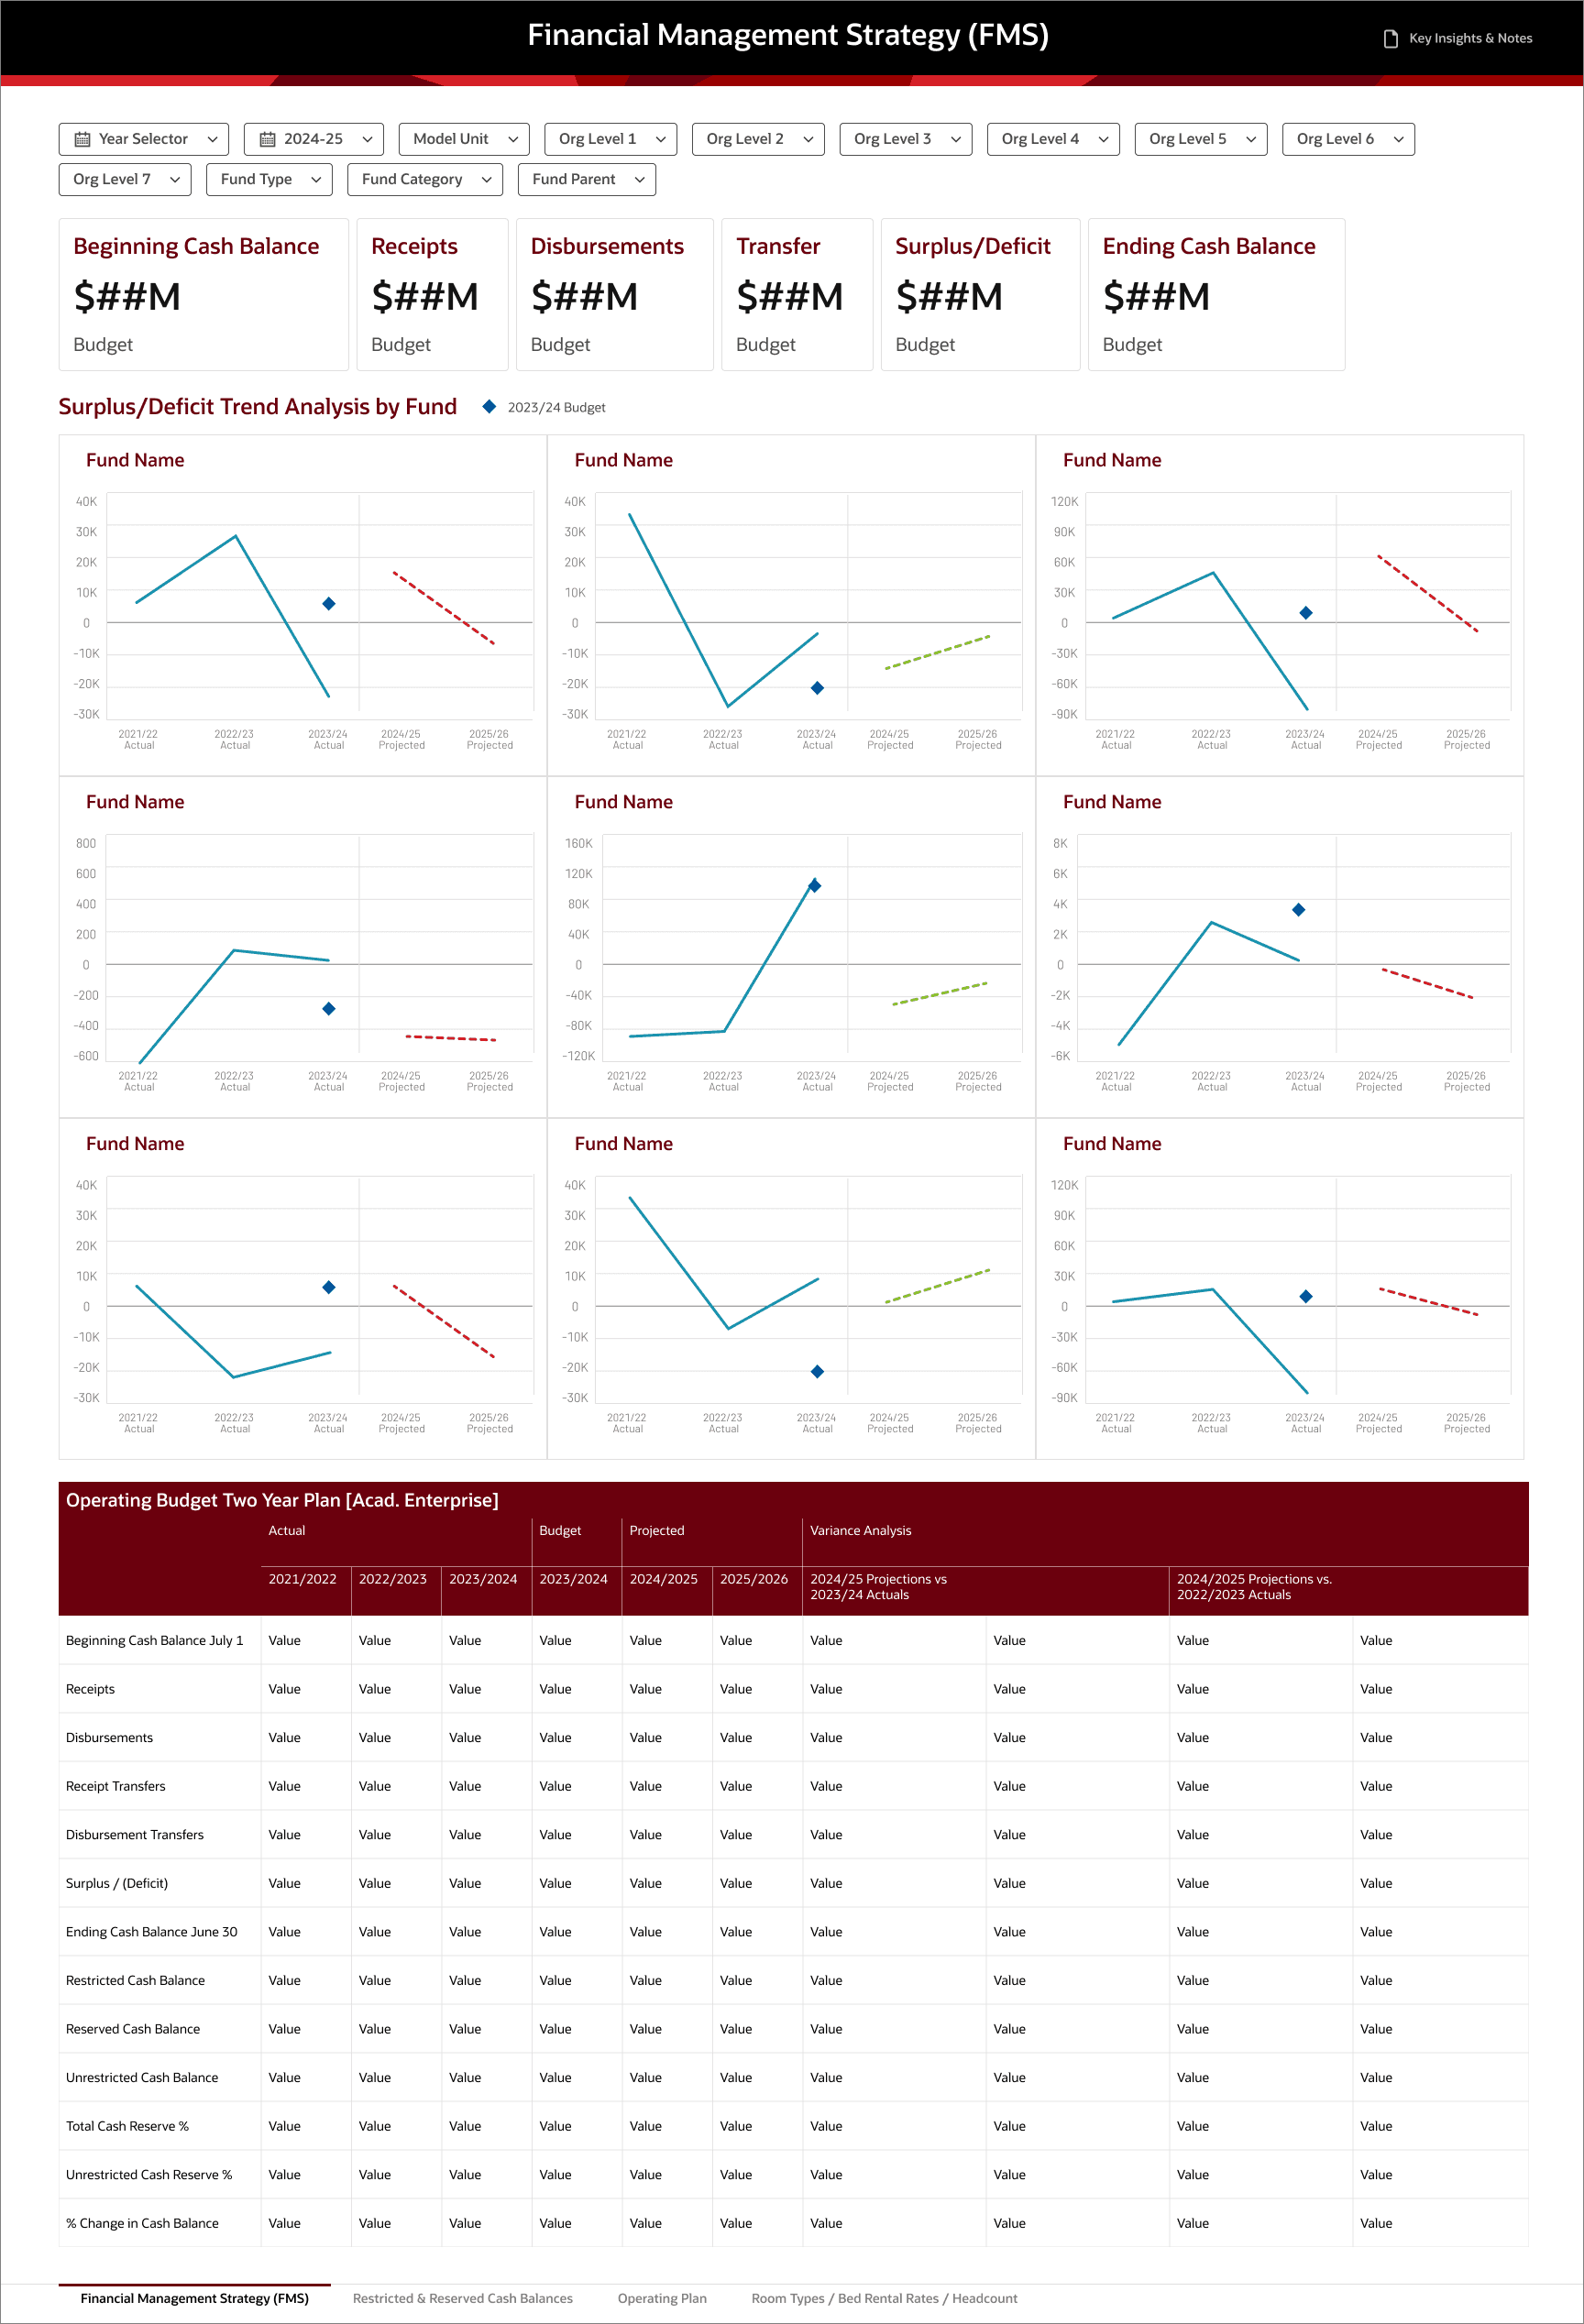
Below is an example where client requested multiple data points to be visually presented. Rather than pushing back directly, I built two versions — the client's request and my recommendation. Seeing both versions side by side, the client agreed with mine because it allows the key trends/takeaways to stand out.
Client's Request

My Recommendation
Why It Mattered
Reduced visual noise and improved scanability
Helped users identify key financial signals within seconds
Challenge 2: Aligning on Data Model Before Visual Design
During early design reviews, I noticed the client struggled to evaluate wireframes because they were unclear on how current-state reports would translate into Oracle FDI data structures. As a result, the discussions focused more on “where is this coming from?” than “is this the right way to present it?”
SOLUTION
I flagged this pattern to the team and recommended we clarify with the client on how current-state reports would map to future-state data structures.
I recommended we first aligned with the client on the data mapping and clarify any questions. Once the client understood the data context, we then presented the dashboard wireframes and asked for targeted design feedback.
Why It Mattered
Improved quality and specificity of client feedback
Accelerated sign-off by separating data debates from design decisions
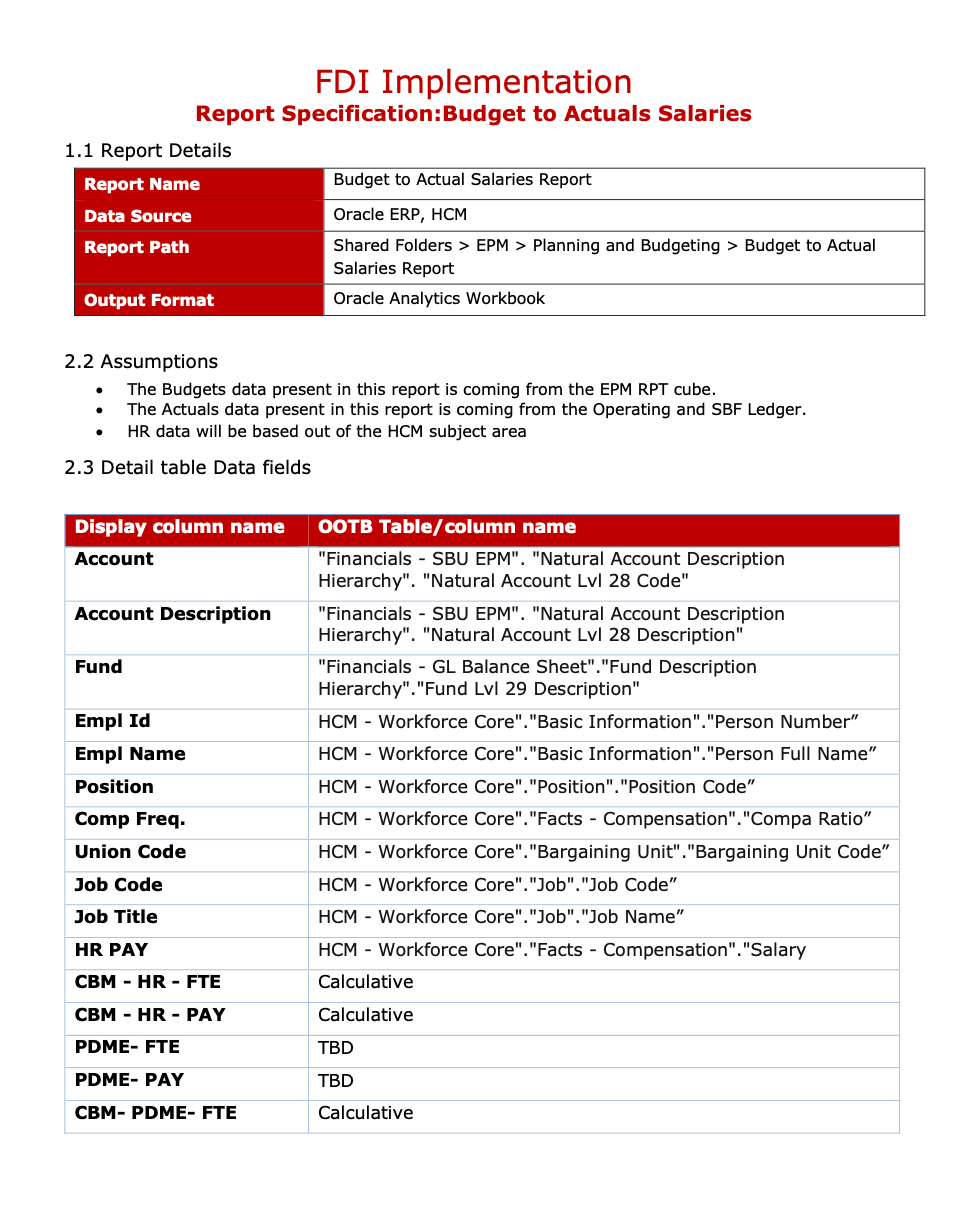
Lean Specs for Data Mapping Alignment
Challenge 3: Designing for Security-Based Data Variations
User access to data varied based on security permissions. Depending on role, some users would see complete datasets while others would see partial or limited data. This created a risk: dashboards that looked clear and meaningful in full-data scenarios could appear empty or confusing when data was restricted. Additionally, our clients were hesitant to sign off on designs without seeing how real data across different roles would render in the system.
SOLUTION
I proactively identified key security scenarios and designed for edge cases rather than assuming full visibility. This included:
Working with the development team to understand how data filtering would affect visual outputs
Structuring charts and KPIs to remain interpretable even with limited data
Aligning stakeholders on expected variations before finalizing layouts
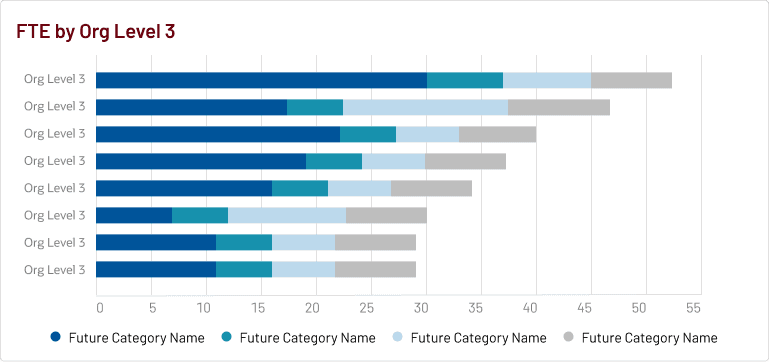
For example, I designed the default view with preset filters that automatically surface the data each user has access to, so no one lands on a blank state. A user with access across all divisions (level 2 orgs) sees a cross-org FTE comparison view. A user scoped to a single division sees only the teams (level 3 orgs ) within it. Same dashboard, different data, based on permissions.

Why It Mattered
Prevented confusion caused by incomplete data views
Increased confidence in dashboard behavior across user types
Ensured consistency and usability regardless of data visibility level
Design System
Without a dedicated budget or timeline for a formal design system, I took the initiative to build a light-weight one from the ground up. I defined standards across typography, spacing, color, iconography, UI components, and data visualization guidelines, creating a shared reference that bridged design and development. With the system in place, designs came together faster and handoffs required far less back-and-forth.

Wireframes


Reflection
What went well:
Strong cross-functional collaboration: By aligning on data models and development feasibility, we reduced rework and kept delivery moving despite aggressive timelines. This collaboration also improved the quality of design reviews, focusing more on business decisions rather than technical uncertainty.
What I wish I had done differently:
Balancing brand, accessibility, and data visualization best practices: Designing within enterprise brand constraints while ensuring accessibility and effective data storytelling required constant tradeoffs. Some brand colors lacked sufficient contrast for accessible data visualization, and balancing aesthetic alignment with clarity was an ongoing tension. In the future, I would advocate for early alignment on a dedicated data visualization color palette that satisfies both brand and accessibility standards.

